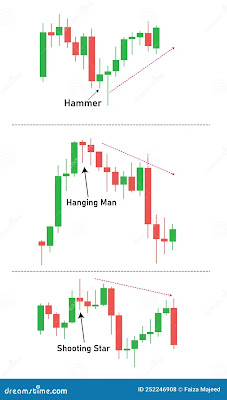
Unraveling the Mystery of the Shooting Star Candlestick Pattern in the Stock Market
Introduction
In the world of technical analysis, traders often turn to candlestick patterns to gain valuable insights into market sentiment and potential price movements. One such pattern that captures the attention of investors is the "Shooting Star." Often seen as a bearish reversal signal, the Shooting Star candlestick pattern can provide valuable clues about possible trend reversals and help traders make informed decisions. In this blog, we will dive into the details of the Shooting Star candlestick pattern, its characteristics, and its significance in the stock market.
Understanding the Shooting Star Candlestick Pattern
The Shooting Star is a single-candle pattern that is easily recognizable due to its distinct shape. It forms when a security's price opens near its high, experiences a significant rally during the trading session, but ultimately closes near its opening price, leaving a long upper shadow and a small real body. The appearance of this pattern indicates that the bears attempted to push the price lower after the rally, and although they succeeded in bringing it down, the bulls managed to bring it back to its opening level.
Key Characteristics of a Shooting Star
Single Candle Pattern: The Shooting Star consists of just one candlestick, making it a simple yet powerful technical indicator.
Upper Shadow: The most prominent feature of a Shooting Star is its long upper shadow, which represents the intraday high price level.
Small Real Body: The real body of the Shooting Star is relatively small and located near the lower end of the candle, reflecting the narrow difference between the opening and closing prices.
Little to No Lower Shadow: Unlike its upper shadow, the lower shadow of a Shooting Star is either nonexistent or extremely short.
Significance of the Shooting Star Pattern
The Shooting Star candlestick pattern holds significant importance in technical analysis due to its potential implications for price movements. When this pattern appears after a prolonged uptrend, it suggests that the bulls may be losing control, and a trend reversal could be on the horizon. However, it is essential to consider the context in which the Shooting Star forms.
Confirmation and Context
For the Shooting Star pattern to be a reliable indicator, traders look for confirmation in subsequent trading sessions. A price decline or a bearish candlestick formation following the Shooting Star reinforces the pattern's validity. Additionally, the location of the pattern in the overall price chart and its alignment with support or resistance levels can provide crucial context.
Risk and Limitations
Like any technical indicator, the Shooting Star candlestick pattern is not foolproof. False signals can occur, especially during periods of high market volatility or in illiquid stocks. Therefore, traders should use the Shooting Star pattern in conjunction with other technical indicators and analysis tools to validate its predictive power.
Conclusion
The Shooting Star candlestick pattern is a powerful tool in the arsenal of technical analysts and traders. Its unique structure and appearance on price charts can offer valuable insights into potential trend reversals in the stock market. However, as with any trading signal, it should not be solely relied upon. Traders are encouraged to combine the Shooting Star pattern with other technical indicators, fundamental analysis, and risk management strategies to make well-informed and prudent trading decisions. Remember, successful trading requires a comprehensive approach that considers multiple factors impacting the market.


Comments
Post a Comment